By the Numbers - Oct. 19, 2015
9,395,892
The total number of prescriptions written for "active component members" in 2014, according an article in the September issue of the Armed Forces Health Surveillance Center's Medical Surveillance Monthly Reports (MSMR) -- Rate of Prescriptions by Therapeutic Classification, Active Component, U.S. Armed Forces, 2014 (PDF).
According to the MSMR report:
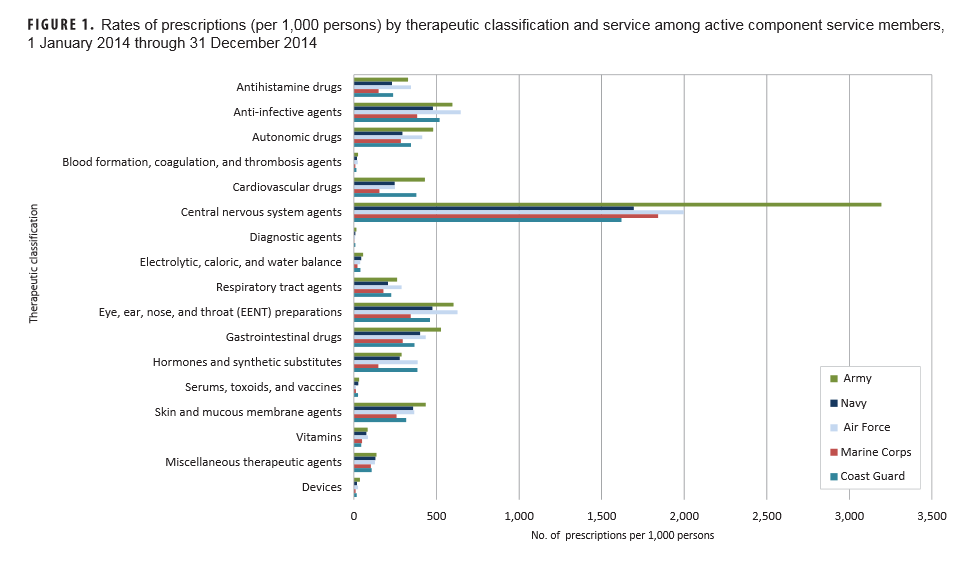
The overall rate was 6,099.9 prescriptions per 1,000 service members, or approximately six prescriptions per service member in 2014. Prescription rates varied substantially by type of drug and by service, age, and occupation for active component service members.
Some additional statistics from the report:
- Drugs categorized as CNS agents accounted for 38% (n=3,606,665) of all prescriptions and had the highest prescription rate (2,341.5 per 1,000 persons) among all drug categories.
- Army members had the highest rate of CNS prescriptions compared with other services.
- Service members ages 49+ had the highest rates of prescriptions in every drug class.
- Service members in healthcare occupations had the highest prescription rates in every drug class.
- Among all Service members, the three subcategories for NSAIDs, opiate agonists, and analgesics/antipyretics accounted for 64% of all prescriptions for CNS agents. Prescriptions for antidepressants represented nearly another 15% of this category.
Medical Surveillance Monthly Report, September 2015, Armed Forces Health Surveillance Center


9,395,892
The total number of prescriptions written for "active component members" in 2014, according an article in the September issue of the Armed Forces Health Surveillance Center's Medical Surveillance Monthly Reports (MSMR) -- Rate of Prescriptions by Therapeutic Classification, Active Component, U.S. Armed Forces, 2014 (PDF).
According to the MSMR report:
The overall rate was 6,099.9 prescriptions per 1,000 service members, or approximately six prescriptions per service member in 2014. Prescription rates varied substantially by type of drug and by service, age, and occupation for active component service members.
Some additional statistics from the report:
- Drugs categorized as CNS agents accounted for 38% (n=3,606,665) of all prescriptions and had the highest prescription rate (2,341.5 per 1,000 persons) among all drug categories.
- Army members had the highest rate of CNS prescriptions compared with other services.
- Service members ages 49+ had the highest rates of prescriptions in every drug class.
- Service members in healthcare occupations had the highest prescription rates in every drug class.
- Among all Service members, the three subcategories for NSAIDs, opiate agonists, and analgesics/antipyretics accounted for 64% of all prescriptions for CNS agents. Prescriptions for antidepressants represented nearly another 15% of this category.
Medical Surveillance Monthly Report, September 2015, Armed Forces Health Surveillance Center